Learn how to create a powerful SEO Google Analytics 4 Dashboard. Here’s how to make your data more insightful and user-friendly so you can optimize traffic.

In this guide, you’ll learn how to build the ultimate SEO Google Analytics dashboard, where you can monitor all the KPIs you care about in one simple place.
- Learn the importance of a centralized SEO dashboard
- Explore differences between GA4 vs Universal Analytics for data reporting
- Learn to build a custom SEO dashboard so you can optimize performance
GA4 doesn’t exactly make it easy to centralize all your data in one place like an excellent SEO dashboard should. But don’t worry—that doesn’t mean you need to create complicated Google Sheets to keep yourself organized.
In this post, I’m going to recommend a different tool to do that part for you—Looker Studio (though other data visualization tools that are similar will work, too).
While it may take some time and adjustment to migrate your SEO Dashboard from UA, you’ll ultimately benefit from the flexibility and customizability offered by GA4, which will allow you to get the most out of your data.
Key Insights
- You can create custom dashboards directly inside of GA$ but our preferred option is to use Looker Studio
- Consider using Looker Studio (formerly Google Data Studio) to automate your data visualization and create a repeatable reporting process using the data from GA4.
- Make sure your report is actionable and actually drives changes instead of just simply reporting on what happened in the past.
What is an SEO Google Analytics Dashboard?
An SEO analytics dashboard is an easy-to-understand, organized visual display of data that offers a graphical representation of your website’s performance metrics.
It’s called a “dashboard” because it helps you gauge the success of your search engine optimization. Not only is it good for monitoring organic traffic but also so you can diagnose issues with website content and track changes in rankings for specific keywords.
Building Your GA4 SEO Dashboard: What To Expect
With the coming sunset date for Universal Analytics (UA) in June 2023, agencies and marketers are hustling to get themselves organized and complete a GA4 audit and setup for their websites. However, once users make the switch, the first question is usually this: how do I build an SEO dashboard in GA4?
Good news first: GA4 can provide you with all the same data as your handy old UA SEO dashboard and more—the data capabilities run very deep.
The bad news? You’ll need to get used to GA4’s new SEO reporting features. That means thinking outside of the old UA dashboard and towards interactive data dashboard tools like Looker Studio (previously known as Google Data Studio) instead.
Of course, if this is your first time setting up an Google Analytics 4 SEO dashboard, then it’s all good news.
Here’s what you need to know to create an insanely powerful SEO analytics dashboard to optimize your campaigns and grow your business.
Universal Analytics Dashboard vs GA4 Reports & Explorations
Reporting got a significant overhaul in GA4. Dashboards were a prominent feature of Universal Analytics and allowed users to view a number of different metrics at-a-glance.
But in GA4, rather than creating a standalone SEO dashboard, you’ll use the Reports Tab to view and create custom reports and the Explore tab to gain insights into the customer journey using Explorations.
The standard reports built into the Universal Analytics interface are configurable in GA4, allowing you more flexibility in creating custom reports for the data you care about. So in GA4, you’ll be in charge of building the reports that make sense for your business.
Other notable GA4 changes include:
GA4 event tracking
Arguably the biggest difference between UA and GA4 is that GA4 offers administrators a robust new set of measurement tools based on Events rather than sessions. The shift from session-based to event-based data models provides a much more comprehensive view of users and their behavior.
GA4 allows admins to track virtually everything as events, including user interactions, e-commerce transactions, and device-specific events. Simply go to “Admin”> “Events” and mark your desired events as conversions to begin tracking.
GA4 acquisition metrics
UA offered several standard reports in the Acquisition category, including a favorite called the Source/Medium report. Digital marketers loved this report because it allowed them to pinpoint the highest-performing channels and allocate marketing budgets accordingly.
In GA4, you can still find organic traffic acquisition metrics in the Traffic Acquisition report.
GA4 conversion metrics
In GA4, there are no more “goal types” (destination, duration, pages/session, smart goals, event goals) but only defined conversion events. Instead, GA4 requires you to specify conversion events similar to goals, except that every conversion event is counted—even if they occur during the same session.

Guidelines for Building Your SEO Dashboard
- Start with your business goals.
The perfect SEO dashboard is one that’s fully customized to do one thing—support growth for your business.
That’s why it’s essential to start with clear business goals in mind. What are you trying to achieve through search engine marketing, and what metrics will help you make sure you’re on the right track?
For instance, do you need to track website visits, conversions, or time on page? Determine what the key performance indicators (KPIs) are for your business before you start building your dashboard.
- Focus on the right metrics.
When building an SEO dashboard, you don’t need to track every single metric to move the needle on growth. In fact, it’s more important to zoom in on only the metrics that matter.
Think about which measurements translate into cold, hard cash and aim to feature those front and center of your dashboard. Keep it simple, and be wary of including extraneous information that doesn’t contribute to the overall picture of your SEO performance.
For example, page views can tell you a lot about traffic, but they don’t necessarily indicate the success of your SEO strategy. Opt instead for metrics that give an idea of your ROI on your efforts, such as conversion events.
- Use data visualizations wherever possible.
Incorporating data visualizations is essential when building an SEO dashboard, as it helps everyone on the team make sense of complex data.
Using charts, graphs, and other visual aids can help to highlight trends, patterns, and anomalies in your SEO strategy, making it easier to identify key insights and opportunities for optimization. That’s where tools like Looker Studio (formerly Google Data Studio) can help make converting data into customizable SEO report templates and dashboards a breeze.
- Think beyond keywords.
Many consider keywords the be-all, end-all of SEO strategy. And while it’s undoubtedly a good idea to link your Analytics account with Google Search Console to zero in the search terms that drive traffic to your site, a solid SEO strategy should consider several other factors.
For example, all of these play a vital role in SEO success:
- Link-building
- Website structure
- Page speed
- User experience
- Mobile optimization
- Backlinks
- Page load time
- Device type
Your SEO dashboard should include a holistic view of these factors, so you can be confident your strategy is sound and is yielding the desired results.
Looker Studio: The Key To Creating the Ultimate SEO Dashboard
Rather than attempting to build your new SEO dashboard from scratch, consider using Looker Studio to help automate your SEO reporting. Looker Studio (aka formerly Google Data Studio) is a free tool from Google that allows you to create custom dashboards and reports based on any data you wish.
While Looker Studio isn’t explicitly designed for SEO analysis, you can use it to make a powerful SEO dashboard.
Here are a few reasons why Looker Studio might be worth considering:
- Centralized data: Looker Studio allows you to centralize your data from various sources, such as Google Analytics, Google Search Console, SEMrush, Ahrefs, and other SEO tools, into a single location. No more hopping from one platform to another to get the insights you need—all your data is in one place.
- Customizable dashboards: Looker Studio’s super user-friendly drag-and-drop interface makes it simple to build a dashboard that displays the data and metrics most important to your SEO strategy. You can also create filters and group data by different dimensions to better understand your performance.
- Collaboration: Looker Studio allows you to share your SEO dashboard with team members or stakeholders. Shareable data facilitates collaboration and ensures everyone responsible for your SEO success has access to the same information, making it easier to make data-driven decisions.
- Real-Time monitoring: Looker Studio provides real-time data and alerts, allowing you to quickly identify changes in website performance and take action as needed. No more waiting days or weeks to see results.
Overall, Looker Studio is a robust tool for creating an SEO dashboard. It’s especially beneficial if you’re still learning your way around GA4 or need to streamline multiple data points, including Google Analytics.
Plus, it’s free. So if you’re looking for a way to build an SEO dashboard that provides valuable insights and encourages collaboration, Looker Studio might be the answer you’ve been searching for.
How to Create a Custom SEO Dashboard Using Looker Studio
- Connect data sources
To get started with your SEO dashboard, you’ll first need to connect your GA4 property with Google Analytics and Google Search Console. But here’s the best part—if you use other SEO tools, such as Yoast or Ahrefs, you can add them to your SEO report, too.
Simply select “Create”> “Data Source,” then search for and select “Search Console.” You may need to authorize your account. Choose your website’s domain, then “Site Impression” and “web.” Select “Add.” Now, you should see your property in Looker Studio.
- Choose Your Metrics
Now, it’s time to add your metrics. First, choose “add a control” from the top to add a date range control. Next, choose an appropriate time frame.
Then, on the right-hand panel, choose “Data.” You should see a number of metrics from both Google Analytics and Google Search Console. Drag and drop your metrics into the report.
- Add Data Visualizations
Once you’ve chosen the metrics to include in your report, it’s time to incorporate visualizations. On the top menu, select “Add a Chart.” Here, you can choose any type of chart you wish. You can easily alter each by selecting it and making alterations using the “setup” and “style” menu.
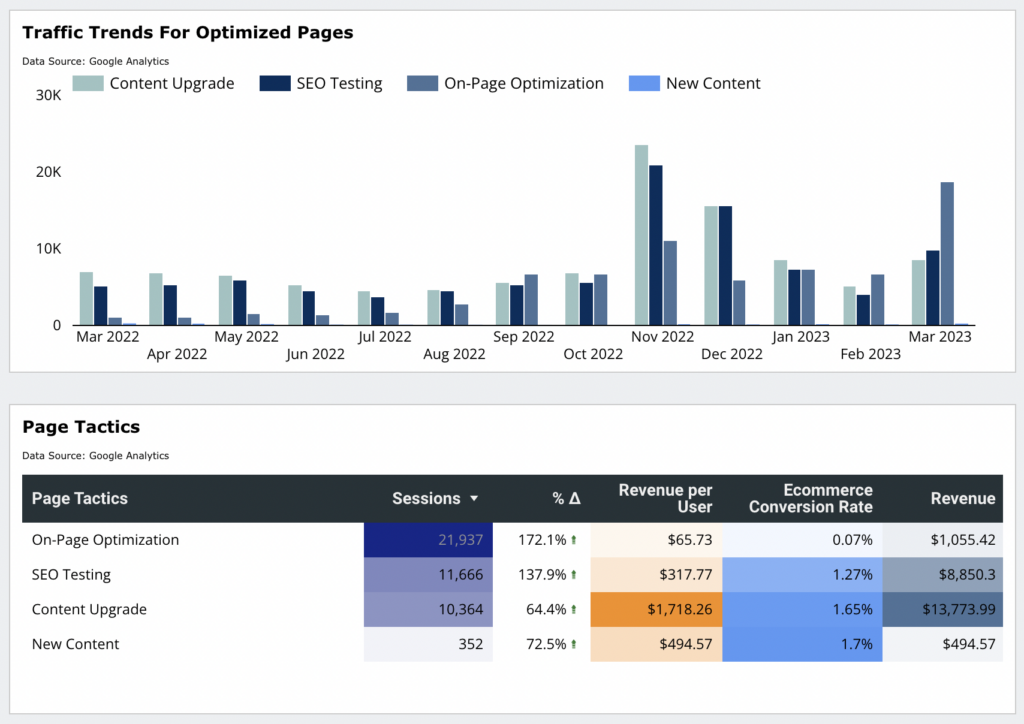
Looker Studio Report Example
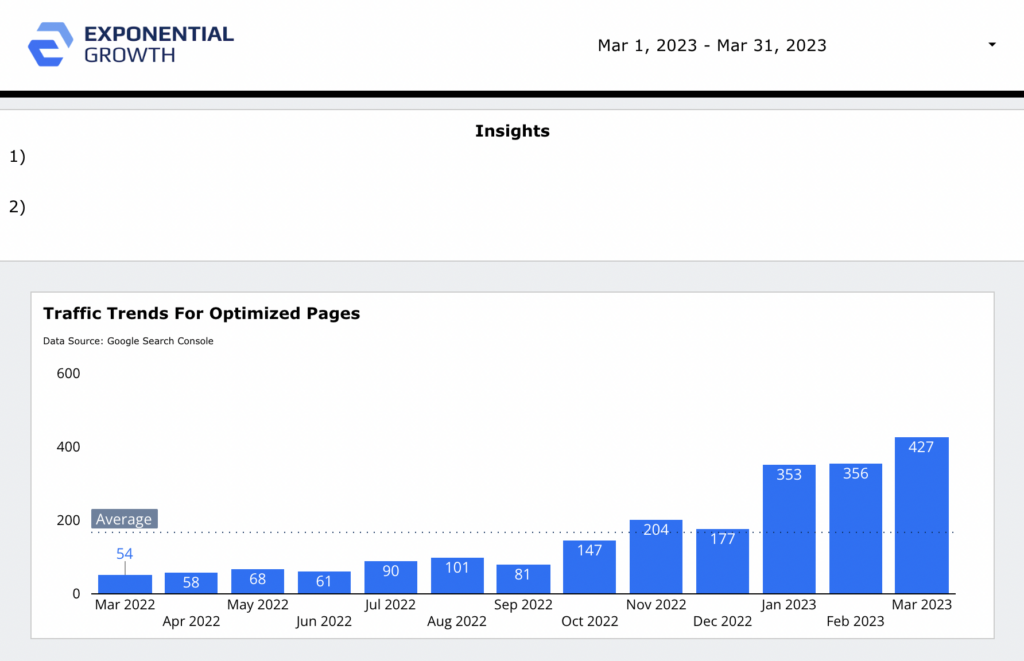
We also like to make an interactive chart where you can see all of the tactics you are utilizing and how each one is performing.
Google Analytics SEO Dashboard Frequently Asked Questions
How do I create an SEO dashboard in Google Analytics?
You can create customized SEO reports in Google Analytics (GA4) to track users, events, and other key performance indicators. However, for a proper dashboard, we recommend using a data visualization tool like Look Studio.
Can you track SEO on Google Analytics?
Yes, you can use Google Analytics (GA4) to track a range of SEO metrics, including conversions and other key events. It also provides insights into user behavior and engagement on your website.
What is an analytics dashboard in SEO?
An SEO analytics dashboard is a tool that provides an overview of your website’s performance. It typically includes data from Google Analytics, Search Console, and other SEO tools like Ahrefs or SEMRush. This helps you monitor and optimize your website’s performance over time.
What does a perfect Google Analytics SEO dashboard include?
Considering Google Analytics 4 no longer includes a dashboard tab, the best SEO dashboards should be organized within data reporting tools like Looker Studio.
These dashboards should consist of metrics that help you reach your business goals and may include events like purchases, video plays, form submissions, subscriptions, and more.
With the right tool to manage your data, you can quickly turn your dashboard into actionable insights that help you optimize traffic and grow your business.
Take Our FREE Google Analytics Assessment
Switching over to Google Analytics 4 is no walk in the park. And with the July 2023 deadline looming, it’s time to start making the transition now.
In just three minutes, our free GA4 Assessment can discover whether your GA4 account is set up correctly or if you’re missing out on the most accurate data and critical features. In addition, you’ll get an instant score after you complete the questions, so you’ll know exactly where your website stands.
If you’d like a thought partner while navigating the shift, then be sure to take advantage of our free Google Analytics assessment.

About The Author
John has spent close to a decade working with marketing agencies in various roles and capacities. Over that time he developed a passion for building systems and processes that allow agencies to improve their service offerings and deliver their service more efficiently.
Frequently Asked Questions
What is an SEO Google Analytics dashboard?
An SEO Google Analytics dashboard is a visual reporting setup that helps you monitor organic traffic, conversions, landing pages, search performance, user behavior, and other key SEO metrics in one organized place.
Why should businesses use an SEO dashboard in GA4?
Businesses should use an SEO dashboard in GA4 because it makes performance easier to understand, helps identify traffic trends, shows which pages drive results, and turns SEO data into actionable insights instead of scattered reports.
Can you build an SEO dashboard directly inside GA4?
Yes, GA4 allows users to create custom reports and explorations, but many marketers prefer using Looker Studio for a more flexible, visual, and shareable SEO dashboard experience.
Why is Looker Studio useful for SEO dashboards?
Looker Studio is useful because it can connect data from GA4, Google Search Console, Ahrefs, SEMrush, and other SEO tools into one dashboard. It also makes reports easier to customize, visualize, automate, and share with clients or team members.
What metrics should an SEO dashboard include?
An SEO dashboard should include organic traffic, conversions, landing page performance, clicks, impressions, keyword visibility, engagement metrics, device performance, page speed signals, backlinks, and any events that support business goals.
How do I create a custom SEO dashboard in Looker Studio?
To create a custom SEO dashboard in Looker Studio, connect your GA4 property, add Google Search Console, choose the metrics that match your goals, add charts and tables, create filters, and organize the report around insights that help improve SEO performance.
What is the difference between Universal Analytics dashboards and GA4 reporting?
Universal Analytics had a traditional dashboard feature, while GA4 focuses more on reports, explorations, events, and custom reporting. GA4 gives more flexibility, but it often works best when paired with a dashboard tool like Looker Studio.
How can an SEO dashboard improve marketing decisions?
An SEO dashboard improves marketing decisions by showing which pages, keywords, channels, and conversion events are performing well. It helps marketers spot problems, find growth opportunities, and prioritize the SEO actions that can drive real business results.